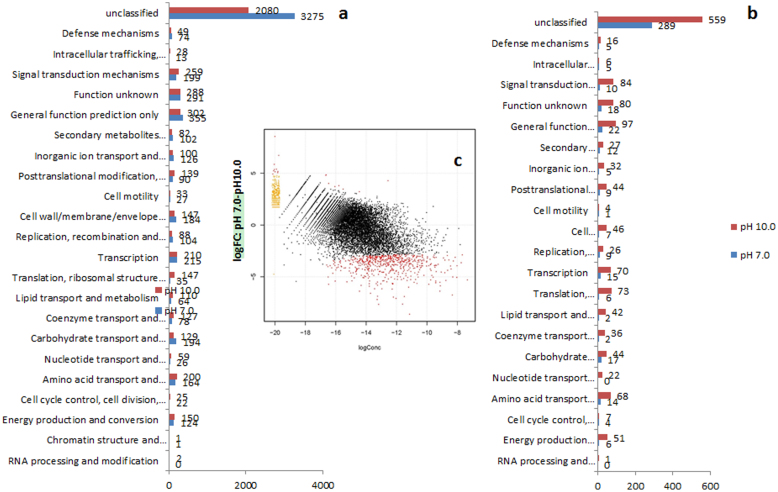
Figure 3. Transcriptomic analysis of S. cellulosum So0157-2 in pH 7.0 and pH 9.0 conditions.
(a) Categories of genes that are differentially expressed at pH 7.0 and pH 9.0. (b) Categories of significantly differentially expressed genes at pH 7.0 and pH 9.0. All detected transcripts were characterized by clusters of orthologous groups (COG) categories. (c) Statistical analysis of gene expression. Plots of the log2 ratio (fold-change) vs. the mean log expression values under pH 7.0 and pH 9.0 conditions. Red dots indicate the differentially expressed genes at a 5% false discovery rate. The yellow and red dots in the upper left corners of the two panels indicate the genes with the largest log fold changes.

