
Figure 2.
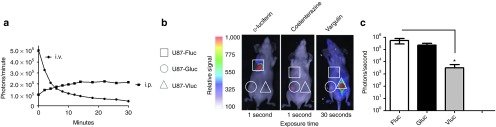
Triple in vivo bioluminescence imaging. (a) 2 × 10⁶ U87 glioma cells stably expressing Vluc were implanted subcutaneously in nude mice. Tumor-associated Vluc signal after iv or ip injection of 4 mg/kg vargulin is shown by a representative mouse from each injection route (n = 3). (b) U87 glioma cells stably expressing Gluc, Vluc or Fluc were injected subcutaneously in nude mice at different sites. Ten days later, sequential imaging of Fluc, Gluc, and Vluc was performed (1 day apart) after injection of D-luciferin, coelenterazine, and vargulin. A representative mouse from each imaging session is shown (n = 3). (c) A region of interest (ROI) was drawn around each tumor location and photons/second were calculated.