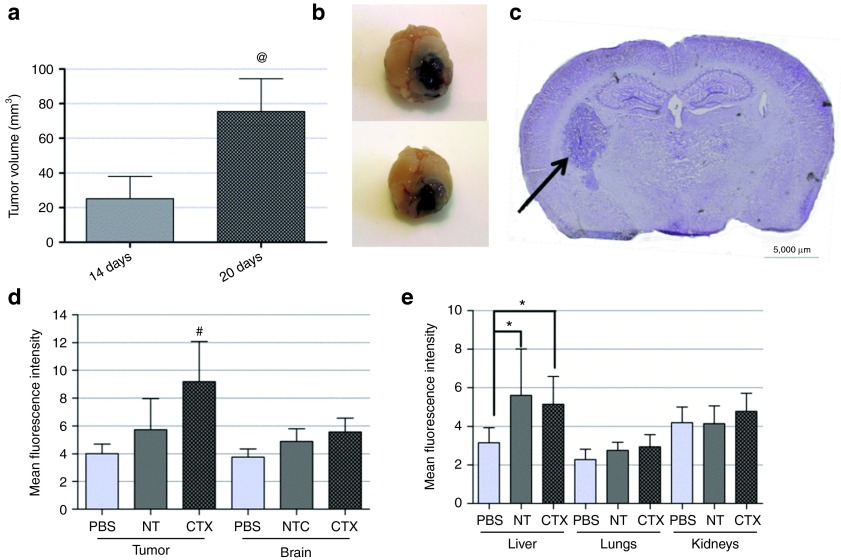
Figure 6.
Tumor characterization and biodistribution analysis of systemically-administered liposome-formulated FAM-labeled small interfering RNAs (siRNAs). Following tumor implantation, animals (n = 3) were killed at defined time points (10, 14, and 20 days), the brains were removed and fixed in 4% paraformaldehyde, frozen and further processed for histological evaluation, as described in Materials and Methods. (a) Average tumor volume (calculated as described in Materials and Methods) on the day of animal killing. Unpaired t-test with Welch's correction was used to calculate the statistical significance. (b) Representative photographs of GL261 tumors 20 days after implantation and (c) representative image of a 20-µm thick tumor section (14 days after tumor implantation), stained with cresyl violet and observed under a light microscope. The scale corresponds to 5,000 µm. Flow cytometry analysis (fluorescence intensity plots) of (d) tumor, brain and (e) liver, kidney, and lung homogenates from animals injected intravenously with chlorotoxin-coupled/nontargeted (NT) liposomes encapsulating FAM-labeled siRNAs or saline solution (phosphate-buffered saline (PBS)). The protocol for intravenous administration and tissue processing is described in Materials and Methods, as well as in Supplementary Materials and Methods. The extent of cellular association was assessed only in viable cells, these being gated on the basis of morphological features (including cell volume and complexity). Relative fluorescence units are indicated for d and e. Values are presented as means ± SD. @P < 0.05 compared to the tumor volume of animals killed 14 days after tumor implantation. #P < 0.05 compared to animals injected with a similar amount of NT stable nucleic acid lipid particle-formulated siRNAs. *P < 0.05 compared to animals injected with PBS.

