Figure 3.
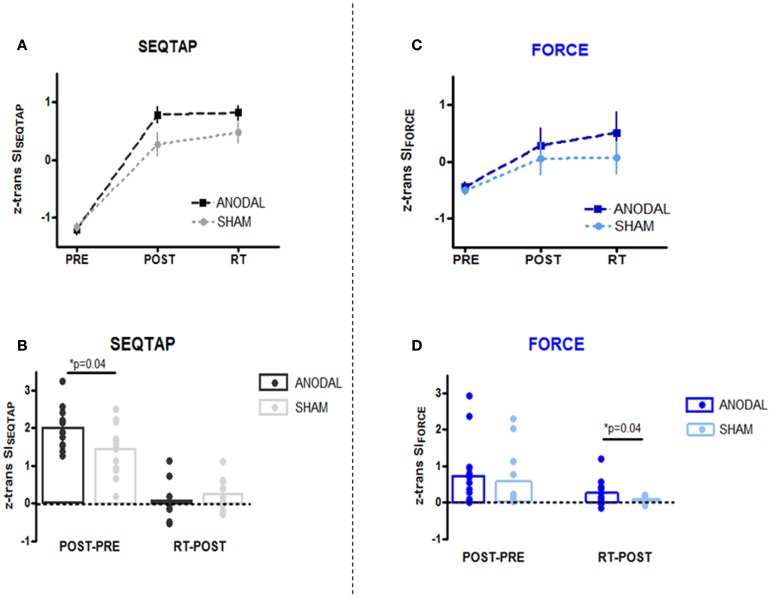
PRE, POST, and RT measurements (upper panel) and learning/retention gains (lower panel). Z-transformed data from Skill Index (z trans SI) are shown for both tasks. (A,B) SEQTAP data: anodal-tDCS (black squares/bars) compared with the sham-tDCS (gray circles/bars). (C,D) FORCE data: anodal-tDCS (blue squares/bars) compared with the sham-tDCS (turquoise circles/bars).

