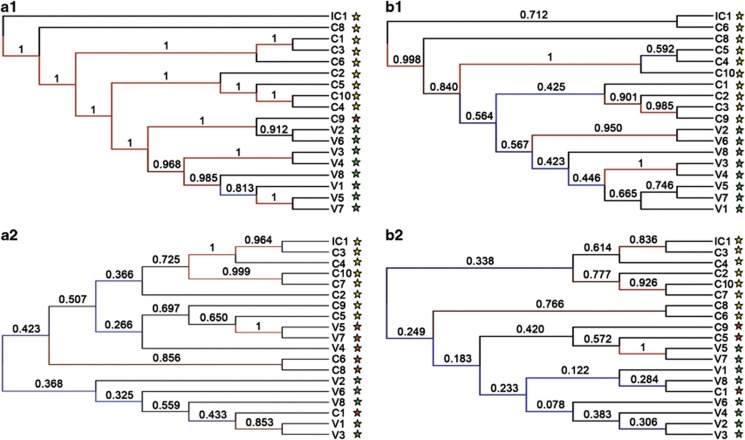
Figure 7.
Cluster tree with jackknifing support for bacteria (a1) and for viruses (a2) obtained with Bray–Curtis dissimilarity matrix on the left, and with Canberra distance matrix (b1) and (b2) on the right. Jackknifing support values of the nodes are represented as well as the color scale for them. Yellow stars represent CD samples; green stars, control samples; and red stars, samples that are grouped within the other group. Ten thousand replicates were carried out.

