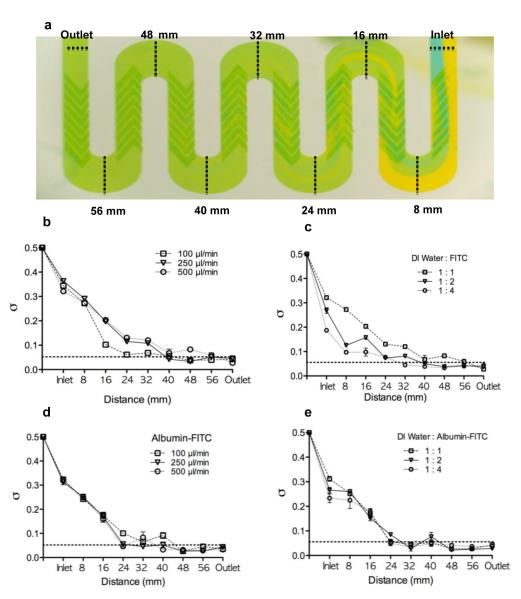
Fig.2. Mixing efficacy of SHMs in the winding-shape serpentine channel using food dyes and fluorescence.
(a) A representive image of the mixing efficacy using 1% blue and 1% yellow food dyes in the inlet serpentine channel at a flow rate of 500 μL/min (n=3). (b) A plot of standard deviation of the FITC intensity as a function of microchannel distance at three flow rates, under constant flow ratio (1:1); n=3. (c) A plot of standard deviation of the FITC intensity as a function of microchannel distance at three flow ratios, under constant total flow rate of 250 μL/min; n=3. (d) A plot of standard deviation of the albumin-FITC intensity as a function of microchannel distance at three flow rates, under constant flow ratio (1:1); n=3. (e) A plot of standard deviation of the albumin-FITC intensity as a function of microchannel distance at three flow ratios, under constant total flow rate of 250 μL/min; n=3. The horizontal dotted line indicates the value of σ that corresponds to 90% mixing (0.05). Data was reported as Mean ± SD.

