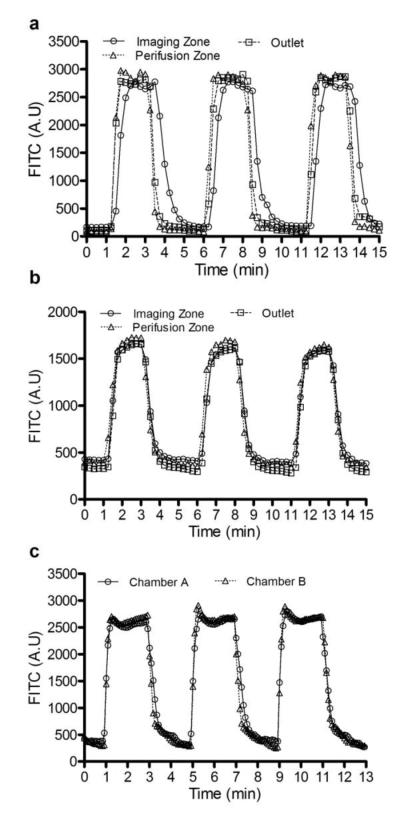
Fig.3. The evaluation of perifusion flow dynamics using FITC and albumin-FITC.
(a) A plot of FITC fluorescence was recorded at three locations in the perifusion chamber: the imaging zone, perifusion zone, and outlet. (b) A plot of albumin-FITC fluorescence was recorded at three locations in the perifusion chamber: the imaging zone, perifusion zone, and outlet. (c) A plot of albumin-FITC fluorescence was recorded in imaging zones of both perifusion chambers. Each imaging cycle was repeated three times over 15-17 min period.

