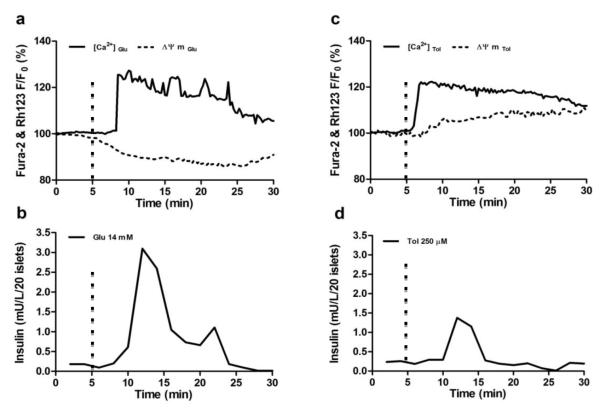
Fig.5. Simultaneous islet perifusion and multi-channel fluorescence imaging in response to glucose and tolbutamide.
(a) A representive fluorescence record of [Ca2+]c and ΔΨM of a mouse islet in response to 14 mM glucose (n=15-20 islets) (b) A representive trace of the insulin kinetics from 20 mouse islets in response to 14 mM glucose (n=3). (c) A representive fluorescence record of [Ca2+] c and ΔΨM of a mouse islet in response to 250 μM tolbutamide (n=15-20 islets). (d) A representive trace of the insulin kinetics from 20 mouse islets in response to 250 μM tolbutamide (n=3). The signals were normalized against basal intensity established before the stimulation and expressed in percentage changes. Flow rate of delivered insulin secretagogues was set at 250 μL/min. The hashmarks indicated time of insulin secretagogues stimulation.

