
Figure 2.
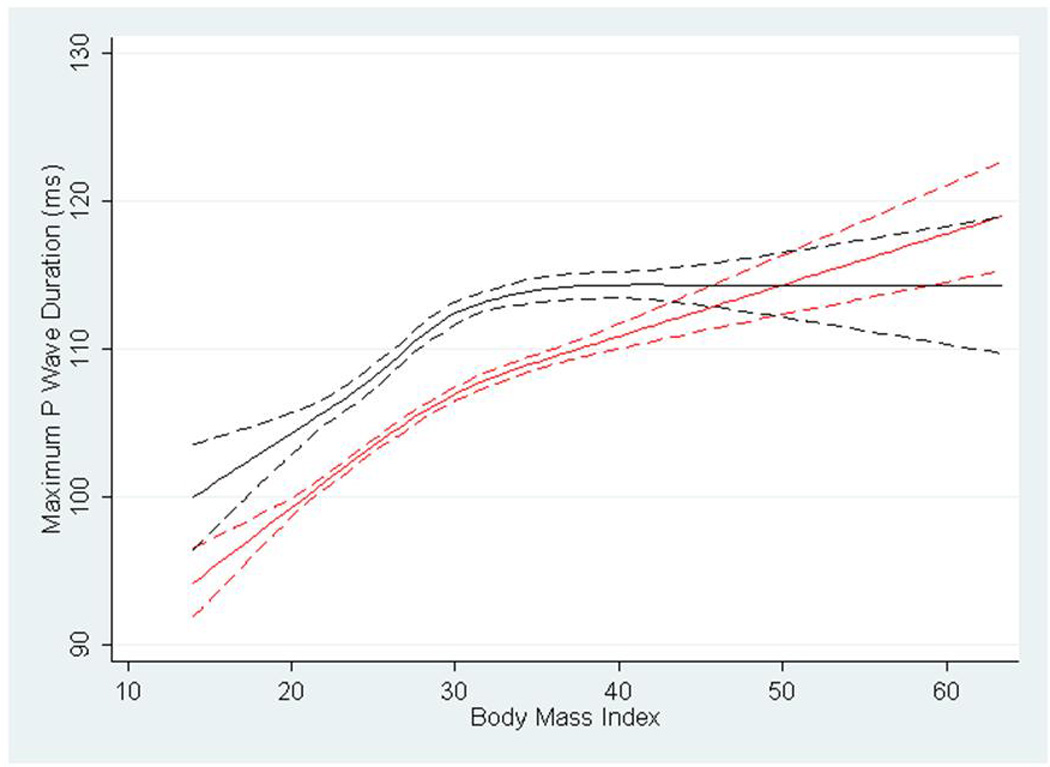
Cubic restricted splines depicting the association of P wave maximum duration and body mass index in blacks (shown in black) and whites (shown in red) in the Atherosclerosis Risk in Communities Study. Dotted lines represent 95% confidence intervals surrounding the estimate.