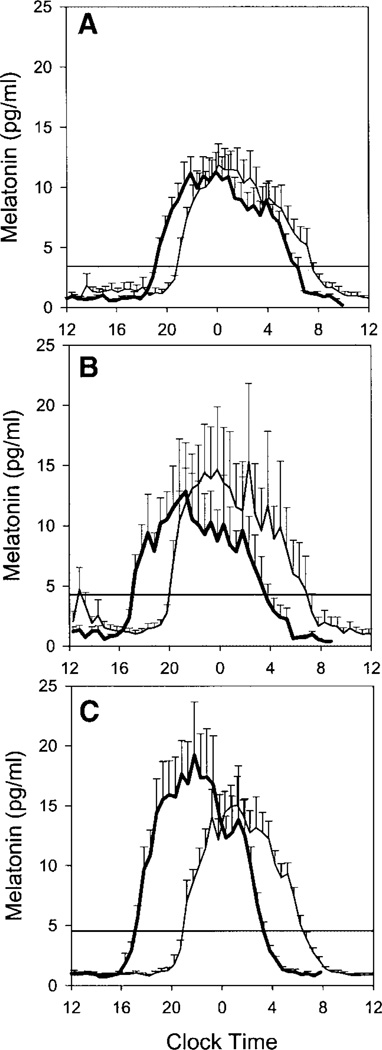
Fig. 2.
Mean salivary melatonin profiles for the placebo (A), 0.5-mg melatonin (B), and 3.0-mg melatonin groups (C). In A–C, the mean melatonin profile during the final CR is indicated by the bold line; the other line illustrates the mean melatonin profile during the baseline CR. Horizontal lines indicate the average dim light melatonin onset (DLMO) threshold for each group. Error bars show SEs. To compile the mean profiles, the individual subjects’ melatonin profiles were aligned with respect to each individual’s DLMO.

