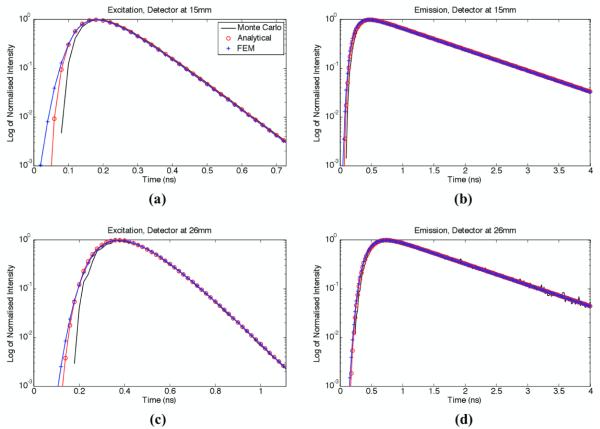
Figure 1.
Normalised TPSF’s for the three light transport simulation models considered: (a) reflected excitation field for a source-detector separation d = 15 mm, (b) fluorescence emission for a source-detector separation d = 15 mm, (c) reflected excitation field for a source-detector separation d = 26 mm, (d) fluorescence emission for a source-detector separation d = 26 mm. The y-axis of all curves is shown on a logarithmic scale.

