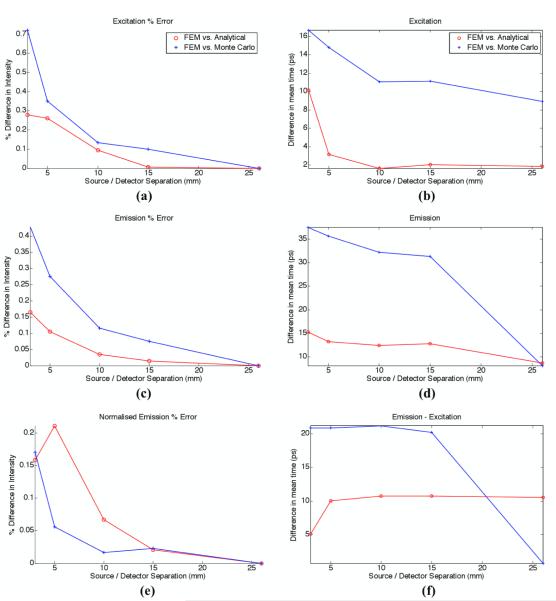
Figure 2.
Percentage error for (a) excitation intensity and (b) excitation mean-time of flight, (c) emission intensity and (d) emission mean-time of flight, (e) normalized intensity of emission (ratio of emission with respect to excitation) and (f) difference in meantime between emission and excitation. All plots represent the difference of FEM model with respect to analytical or Monte Carlo model.

