
Figure 5.
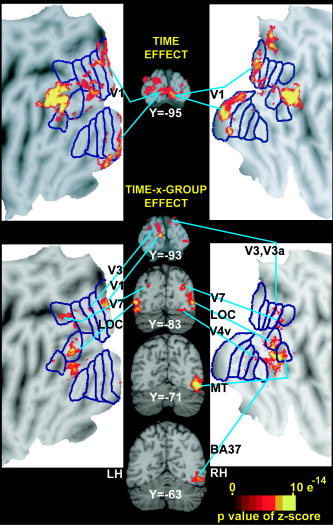
Selected coronal sections (in Talairach atlas space) [Talairach and Tournoux,1988] and flat maps through visual cortex regions identified from the effects of time (top) and time‐by‐group (bottom) factors in a voxel‐based ANOVA. See Figure 2 for abbreviations and citations that explain flat maps. LH, left hemisphere; RH, right hemisphere.