
Figure 6.
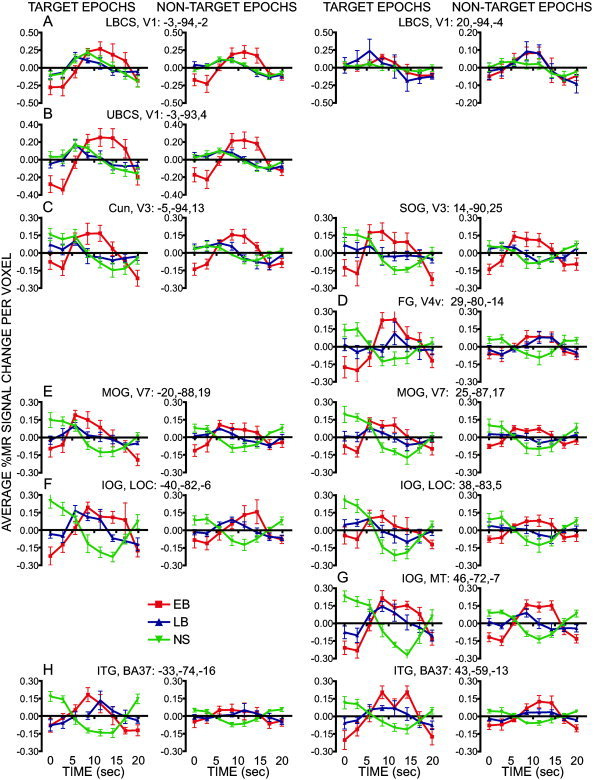
Regional time courses extracted for each epoch type and group are plotted for regions of interest identified from the effects of the time (A) or time‐by‐group (B–H) in a voxel based ANOVA. Data at each time point show group mean and S.E.M. (early blind, EB; late blind, LB; sighted, NS). Plots from left hemisphere regions are shown in the left two columns and those from right hemisphere regions are shown in the right two columns. Each region is identified by its cortical location, visual area, and atlas coordinate location for the regional center of mass. The plots are arranged to follow the top‐to‐bottom and left‐right order of regions shown on the coronal sections in Figure 5. Cun: cuneus gyrus; FG: fusiform g; IOG: inferior occipital g; LG: lingual g; MOG: middle occipital g; SOG: superior occipital g.