
Figure 7.
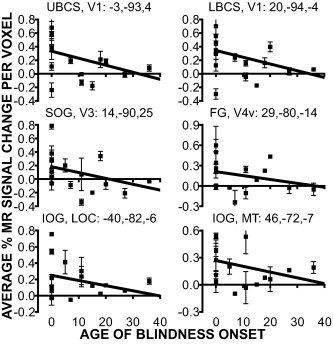
Magnitude of BOLD responses as a function of age of blindness onset in defined regions. Title for each graph identifies the anatomical location, visual area, and atlas coordinates for the centers of mass from the ANOVA effects (see Table II). Each point shows single participant mean and S.E.M. for target and non‐target epoch types.