
Figure 8.
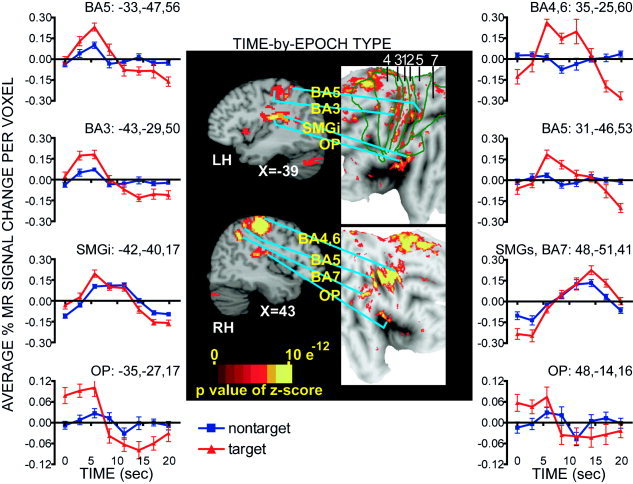
Selected sagittal sections (in Talairach atlas space) [Talairach and Tournoux,1988] and flat maps through sensorimotor cortex regions identified from the effect of the time‐by‐epoch‐type factor in a voxel based ANOVA. Brodmann area (BA) borders for BA 4, 3, 1, 2, 5, and 7 taken from a canonical brain [Van Essen et al.,1998; Van Essen,2002a,b]. Regional time courses extracted for each epoch type are plotted for regions where cross‐correlation response magnitudes differed significantly between target and non‐target epochs. Plots from the left hemisphere (LH) regions are shown on the left and those from the right hemisphere (RH) regions are shown on the right in the vertical order that the regions are labeled on the brain images. OP: parietal operculum;SMGi, SMGs: inferior and superior parts of supramarginal gyrus.