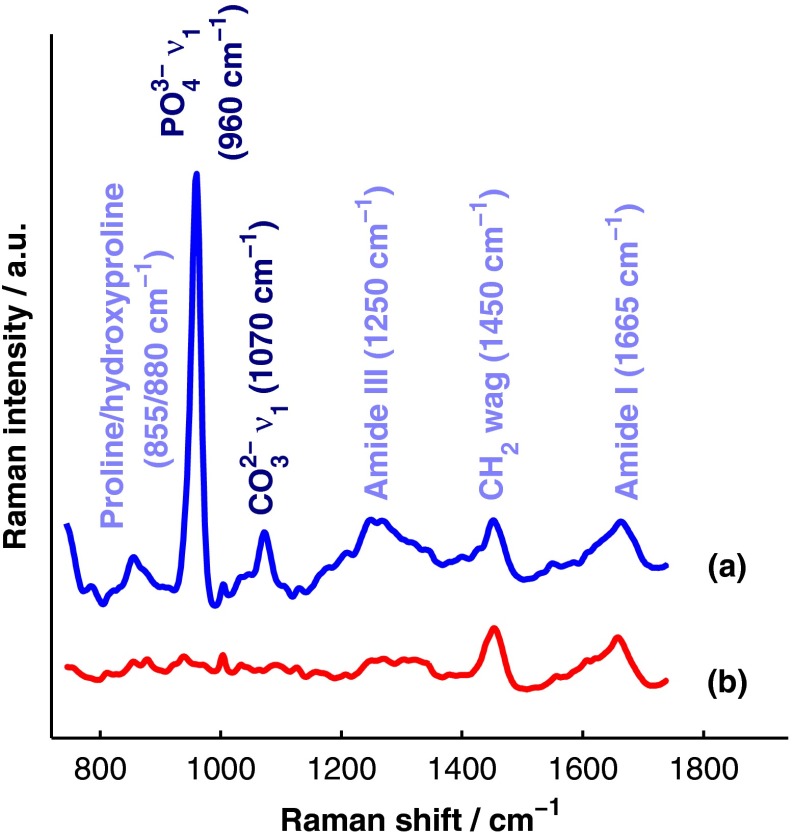
Fig. 1.
(a) Representative Raman spectrum of bone. Major Raman bands are labeled along with their peak positions (in parentheses) in Raman shift. Bands associated with mineral content are labeled in dark blue and bands associated with the organic matrix are labeled in light blue. Note that is present both in the organic matrix of bone as well as in adipose tissue found in the medullary cavity. (b) Representative Raman spectrum of soft tissue. Notice the large degree of spectral overlap with the bands associated with organic bone matrix.

