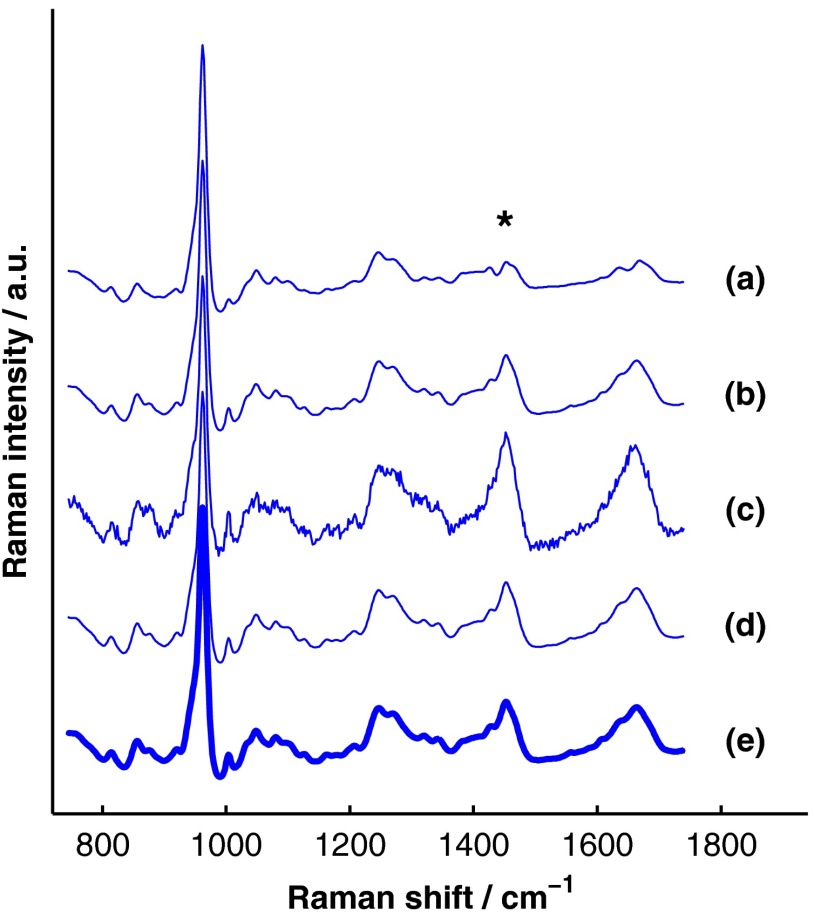
Fig. 6.
Comparison of BTEM and SOLD bone-spectrum estimation methods operating on simulated data. (a) BTEM and (b) SOLD estimates of exposed-bone spectrum from transcutaneous data set without noise. (c) BTEM and (d) SOLD estimates from data set with added noise. (e) True simulated bone spectrum for comparison. To guide comparison, the asterisk highlights the wag peak, which was more accurately reconstructed with SOLD.

