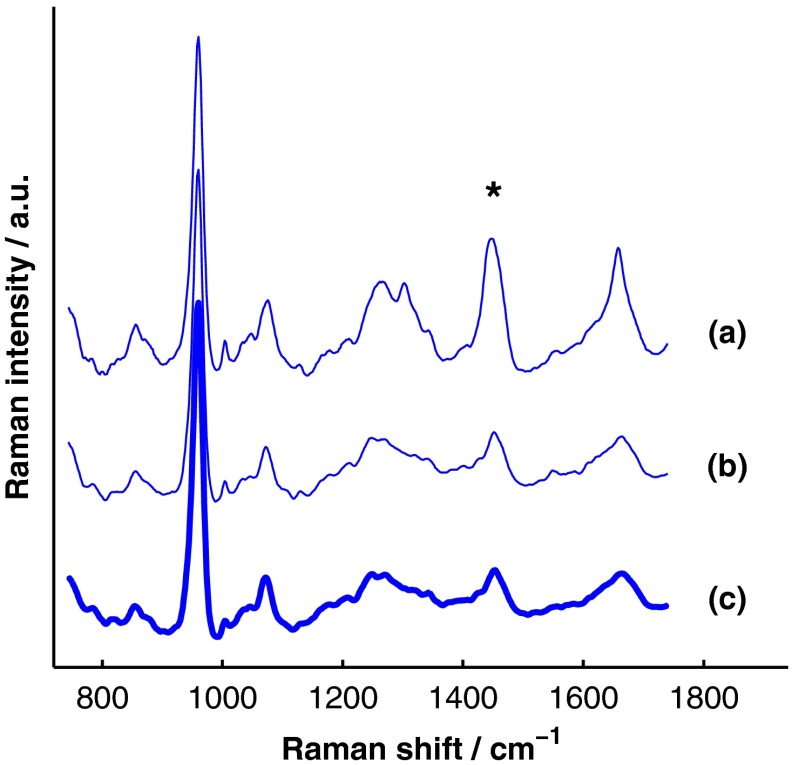
Fig. 9.
Comparison of BTEM and SOLD bone-spectrum estimation methods operating on experimental data. (a) BTEM and (b) SOLD estimates of exposed-bone spectrum from representative transcutaneously acquired data set presented in Fig. 8. (c) True exposed-bone spectrum for comparison. To guide comparison, the asterisk highlights the wag peak, which was more accurately reconstructed with SOLD.

