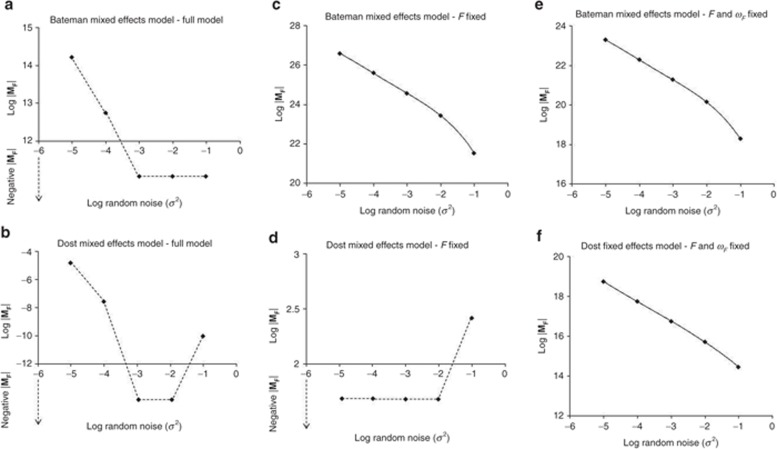
Figure 2.
Graphical representation of log |MF| vs. log random noise (σ2) for simple mixed-effects pharmacokinetic models. In this graph, log |MF| above the abscissa are as represented. Data below the abscissa represent the negative determinants that do not have log values and are shown for the purpose of displaying discontinuity of the line. (a,c,e) Bateman model, (b,d,f) Dost model; left column: all parameters estimated, middle column: F fixed, right row: F and ωF fixed.

