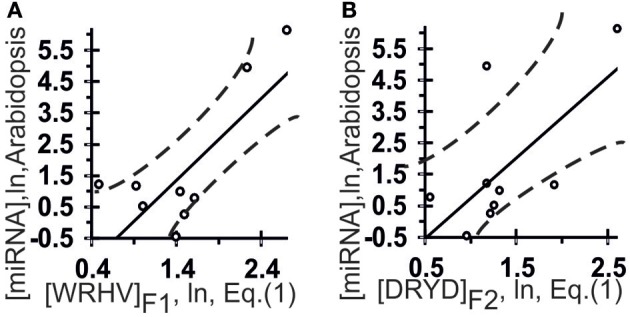
Figure 3.

Control test of the patterns (the x-axis) found by ACTIVITY (Ponomarenko et al., 1997) in the training dataset (Table 1) using independent experimental data (the y-axis) taken from the same data source (Axtell and Bartel, 2005). Two linear correlations in Arabidopsis: one (A) between miRNA abundance in the plant and [WRHB]F3 abundance in these miRNAs and one (B) between miRNA abundance and [DRYD]F4 abundance. Both are statistically significant in the control dataset of 11 miRNAs (Axtell and Bartel, 2005). Dashed curves depict 95% confidence intervals for linear regression (solid lines) built using STATISTICA (Afifi et al., 2003).
