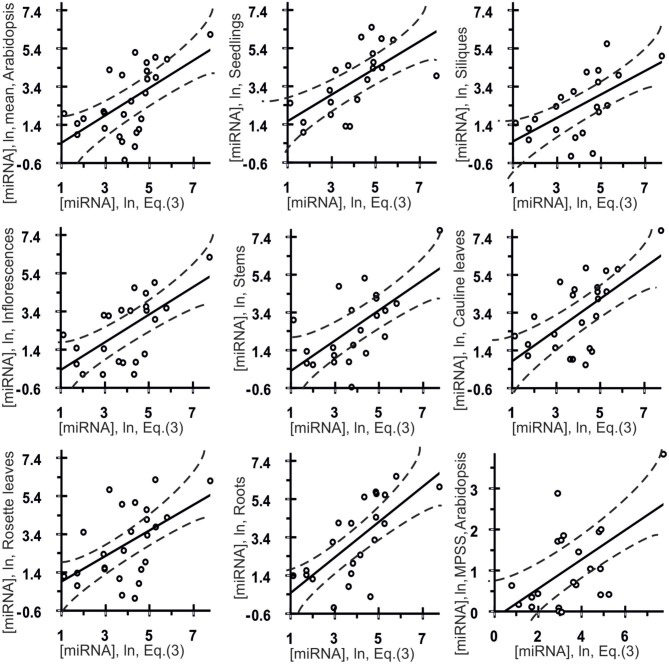
Figure 4.
Control test of the final equation (3), the x-axis, derived with ACTIVITY outputs (Ponomarenko et al., 1997) on the training dataset (Table 1) and using independent experimental data (the y-axis) taken from various data sources. Twenty seven correlations in Arabidopsis (Table 3) between the miRNA abundance estimated by Equation (3), the x-axis, and those measured experimentally, the y-axis, namely: the mean abundances of 28 canonical miRNAs used above, the organ-specific abundance of these miRNAs in seedlings, siliques, inflorescences, stems, cauline leaves, rosette leaves, and roots as independently measured in vivo (Axtell and Bartel, 2005), and, finally, the abundances of 22 miRNAs obtained using Massively Parallel Signature Sequencing (MPSS) by Lu et al. (2005) as independent experimental control datasets. Dashed curves and solid lines as in the legend to Figure 3.

