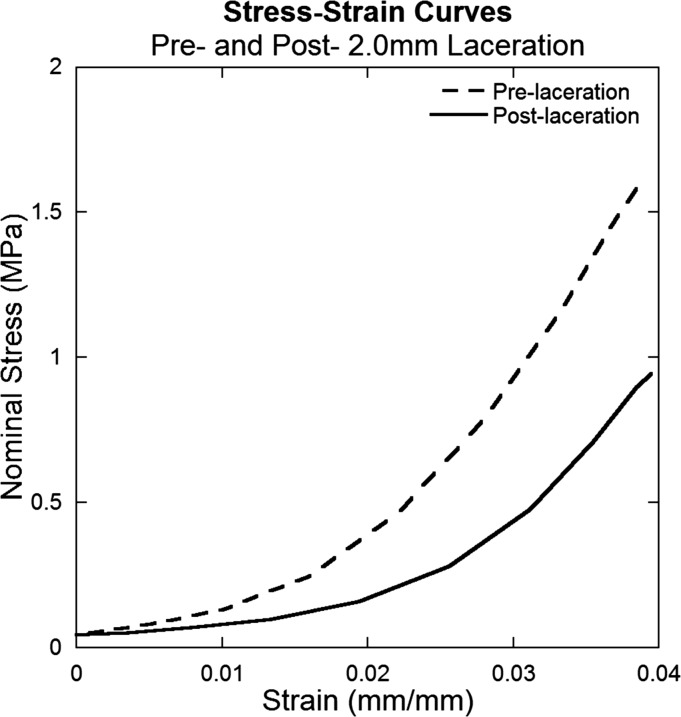
Fig. 4.
Representative stress-strain curves for pre- and post-laceration data for a tendon subjected to a 2.0 mm laceration. Data were obtained from the initial pull of the cyclic testing. Initiation of stress application occurs at a larger strain and nominal stress (force divided by original cross-sectional area) decreases post-laceration.

