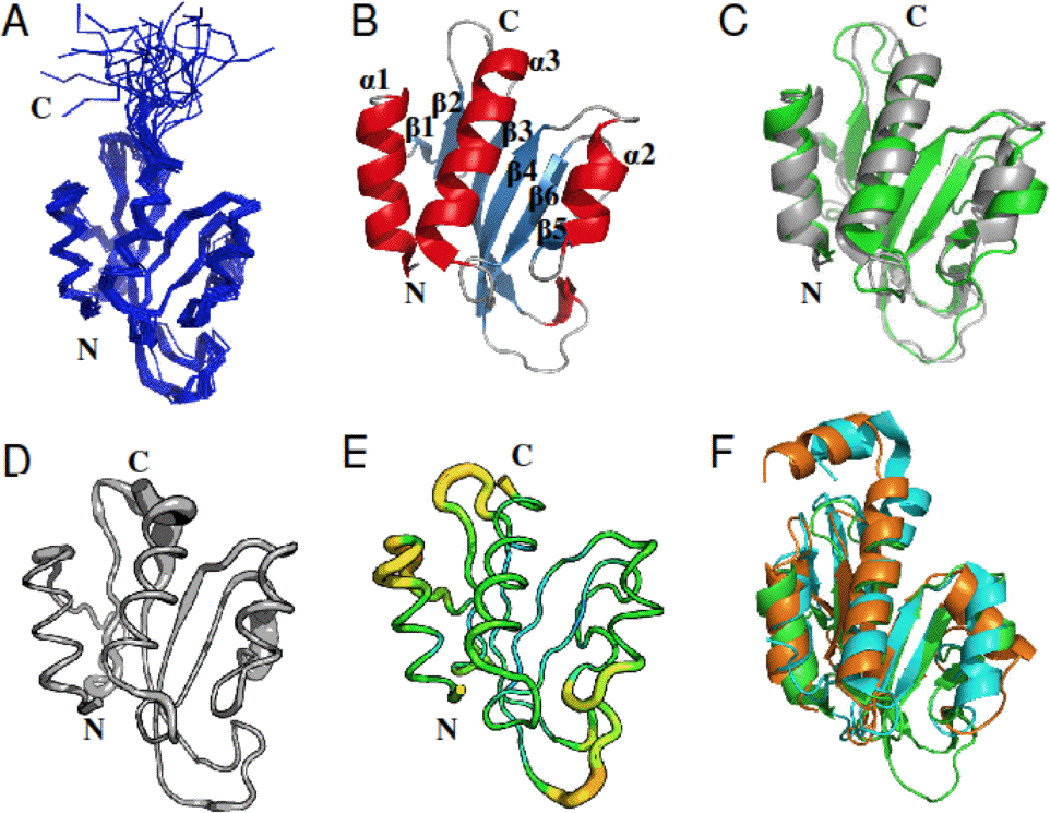
Figure 1.

Three-dimensional structure of the Pspto_3016 protein from P. syringae (PDB IDs 2KFP and 3H9X). A) Backbone trace of the ensemble of 20 solution NMR conformers for residues 2–125 including the His6 affinity tag. B) Ribbon diagram of the NMR structure for the conformer with the lowest energy from CNS refinement. Secondary structure elements are denoted α1–3 and β1–6 for respective features. C) Alignment of the X-ray structure (green) with the lowest energy NMR conformer (gray). D) Sausage diagram of the NMR ensemble according to the RMSD in backbone Cα position represented as the thickness of the trace. E) Sausage diagram, of the X-ray structure where the thickness of the trace is reflected by increasing backbone B-factor (PyMOL script from PDBe). F) Alignment of the Pspto_3016 X-ray structure (green) with the X-ray structure of DR2400 (PDB ID 2A1V) from D. radiodurans (cyan) and NMR structure of YjbR (PDB ID 2FKI) from E. coli (orange). Unless otherwise noted, residues 2–117 are shown for Pspto_3016, residues 3–130 for DR2400, and residues 2–118 for YjbR. All structures were rendered withand alignments performed with PyMOL [27].
