
Fig. 4.
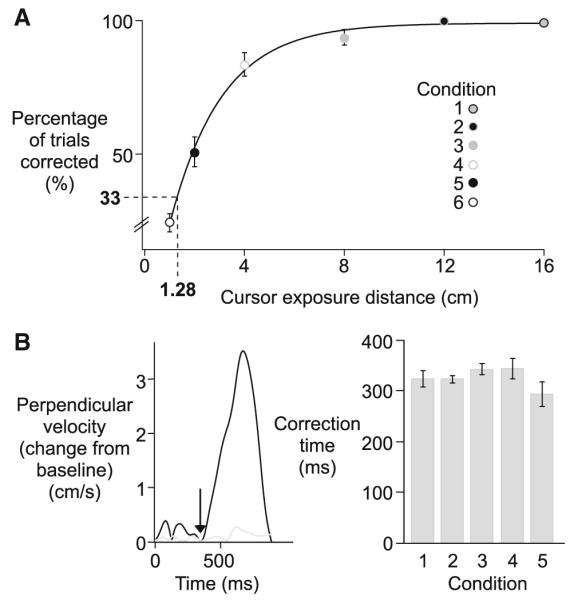
Experiment 1. a Percentage of trials corrected (means ± standard errors, across subjects) is plotted as a function of cursor exposure distance for each condition (exponential line-fit; y = 99.053 – 122.15e(−0.48208x); black line). b Perpendicular velocity (change from baseline) for a sample corrected (black) and uncorrected (gray) trial, with the first measurable response of the corrected trial indicated with an arrow (left). Correction time (mean values ± standard errors, across subjects) for each condition (right)