
Fig. 5.
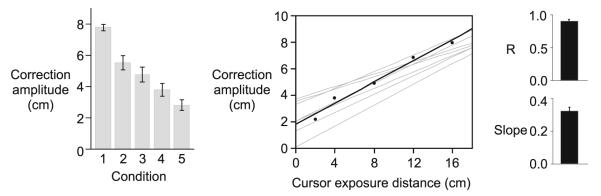
Experiment 1. Correction amplitude (mean values ± standard errors, across subjects) for each condition (left). Mean correction amplitude is plotted as a function of cursor exposure distance from a representative subject (black; middle). Linear regressions for all other subjects are shown in gray. The correlation coefficient (mean ± standard error, across subjects) and slope (mean ± error, across subjects) for mean correction amplitude versus cursor standard exposure distance (right)