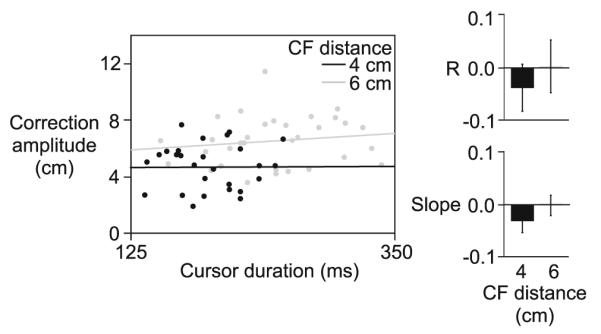
Fig. 7.

Experiment 2. Correction amplitude is plotted as a function o f cursor duration for the 4 cm (black) and 6 cm (gray) CF distance, for a representative subject (left). Correlation coefficients (mean values ± standard errors, across subjects) and slopes (mean values ± standard errors, across subjects) are displayed for the small (4 cm) and large (6 cm) CF distance (right)
