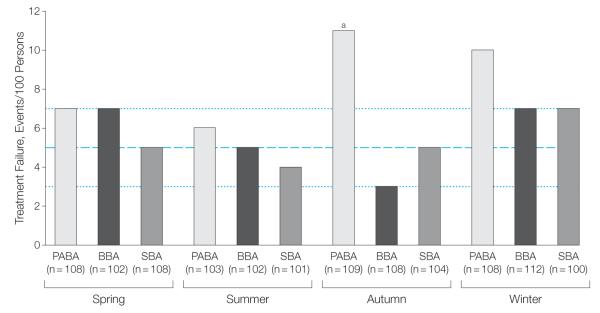
Figure 5.

Treatment Failure by Season
Spring included March, April, and May; summer, June, July, and August; autumn: September, October, and November; and winter: December, January, and February. The dotted lines indicate the lower and upper number of all treatment failure events in all groups across the 4 seasons (range, 3-7); the dashed line indicates the middle value of 5 treatment failure events (actual mean of the 10 within-range observations: 5.6). The physician assessment–based adjustment (PABA) group showed a significantly higher number of treatment failure events during autumn vs either the symptom-based adjustment (SBA) group or the biomarker-based adjustment (BBA) group.
aP=.02 for PABA vs BBA and SBA in autumn). We infer from these data that the expected number of treatment failure events for all 3 treatment modalities is typically 5 per 100 persons or about 5%, doubling to 10% to 11% in the autumn and winter within the PABA group.
