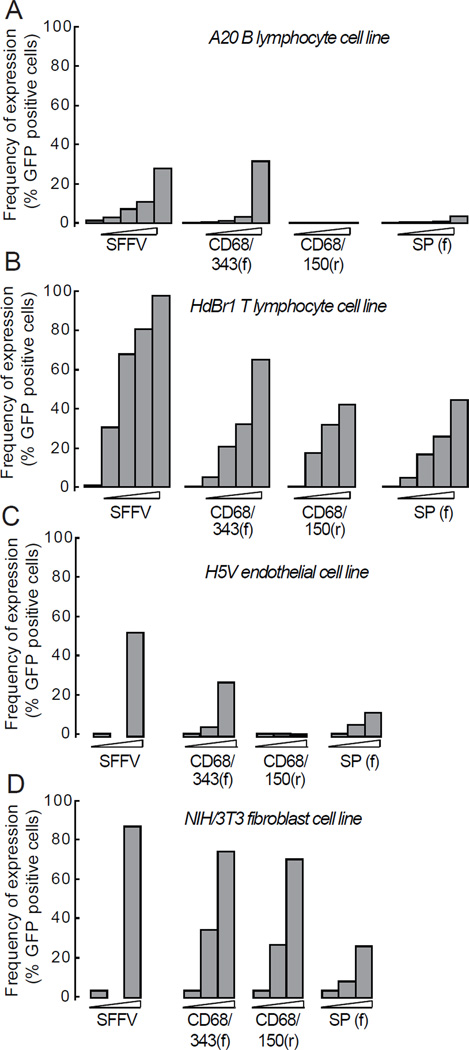
Figure 4. GFP expression in non-macrophage cell lines in vitro.
(a) NIH/3T3 fibroblasts, (b) H5V endothelial cells, (c) HDBR1 T cells, (d) A20 B cells were transduced with MSPs of increasing MOI. Fibroblasts and endothelial cells were harvested at day 5 and T and B cells at day 7 after transduction and GFP expression was analyzed by flow cytometry. Results show data pooled from two independent experiments. See statistical analyses in Supplementary Table S2.

