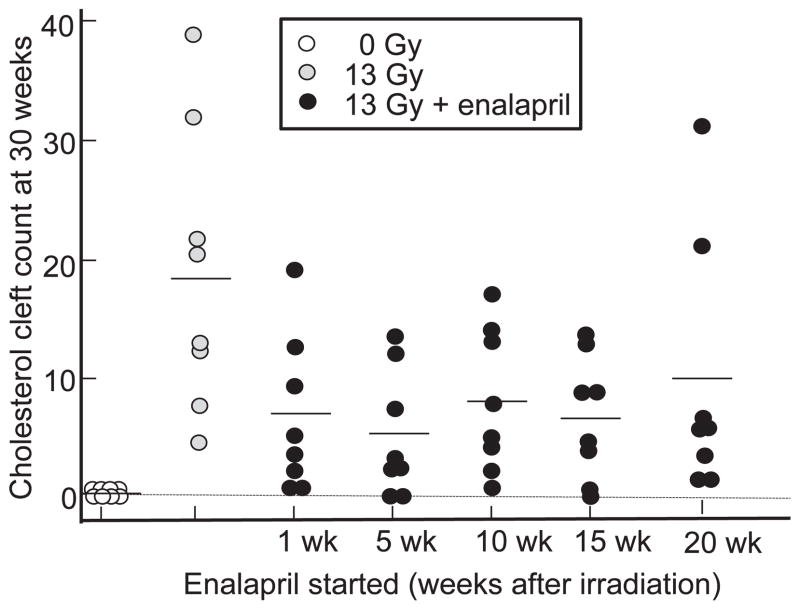
FIG. 6.
Scatter plots of cholesterol cleft counts at 30 weeks in unirradiated rats (open circles) and after 13 Gy irradiation to the whole thorax (gray circles). The black circles represent 13 Gy + enalapril 60 mg/L started at 1, 5, 10, 15, and 20 weeks after irradiation and continued to 30 weeks (210 days). n = 8 rats/group. The line in each group represents the mean value.

