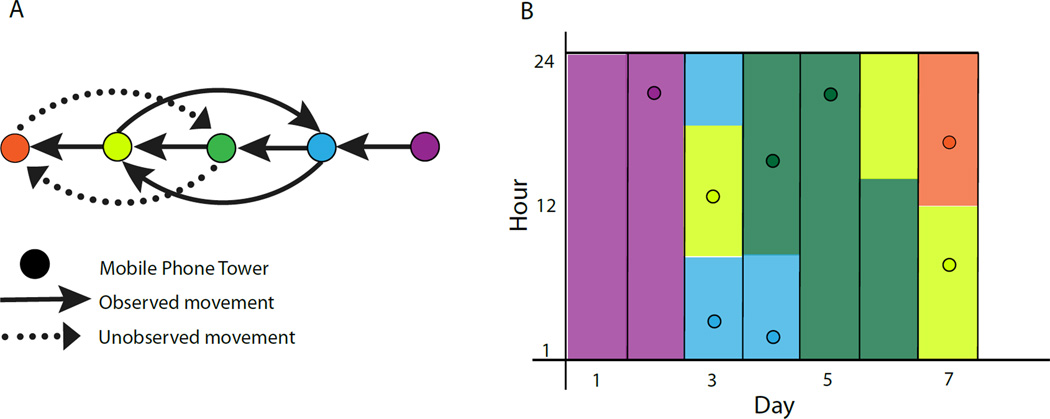
Figure 2. Approach to using CDRs to approximate location and movement for a subscriber.
A) Observed and unobserved movements between cell towers. Each circle represents a mobile phone tower with arrows indicating the day and direction of movement. Solid arrows indicate movement that can be measured using CDRs. Dotted arrows indicate movements that will not be measured. B) The estimated location and time of the subscriber for all 7 days. Points show the time of each call record (y axis) for each day of the week (x axis), with the color indicating the tower at which the call was made. Column colors represent the inferred location of the subscriber; it is assumed that the caller is at the mobile phone tower that routed their most recent call or text, and transitions between towers occur half way between two calls.

