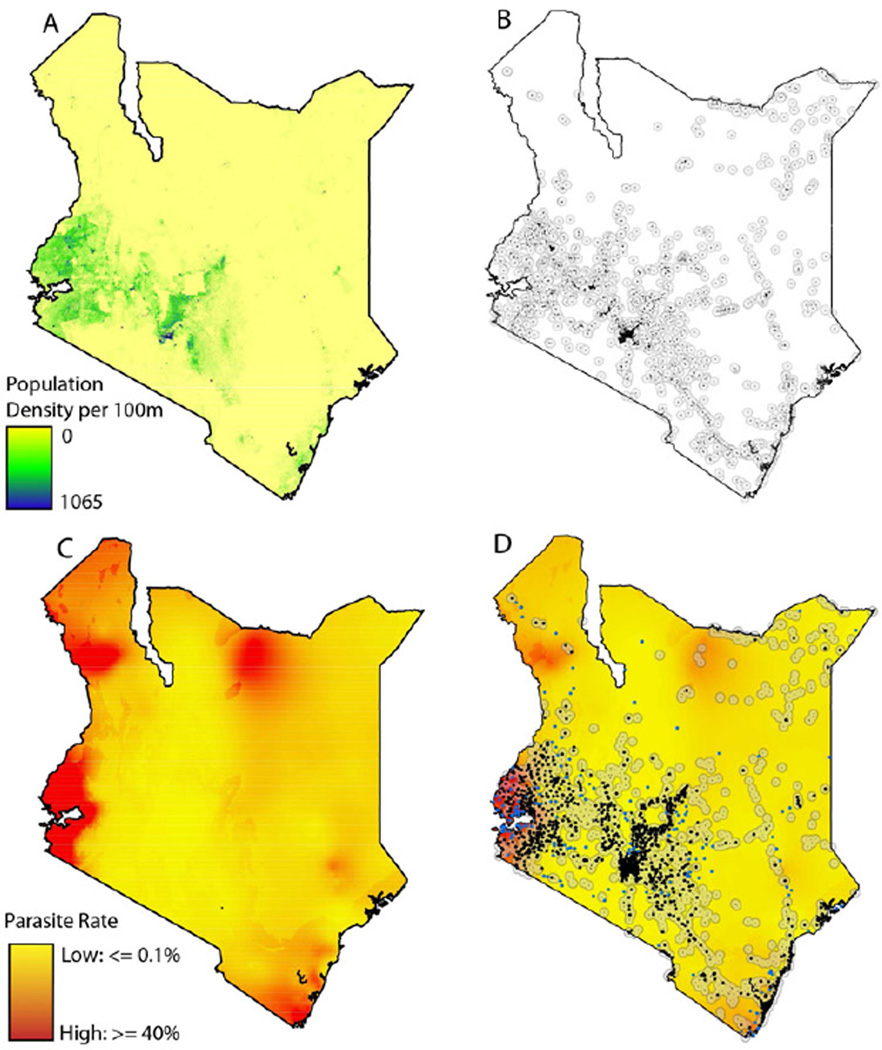
Figure 3. Data layers for defining resolution of mobility estimates.
A) The population density of Kenya with data from Afripop. B) The location of settlements in Kenya. A 10km buffer is drawn around each settlement to define a catchment area. C) The parasite rate in Kenya with data from MAP. D) The location of mobile phone tower in Kenya overlaid on a settlement and parasite rate maps.

