
Figure 1.
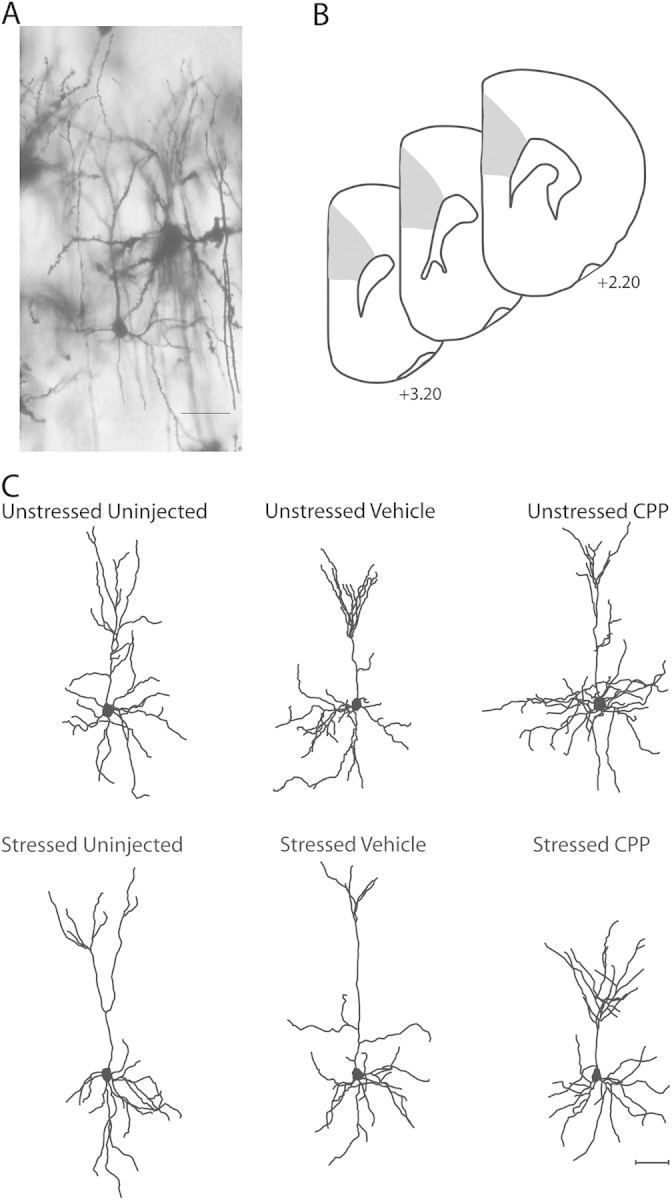
(A) Digital light micrograph of Golgi-stained neuron in layers II–III of mPFC in an unstressed vehicle-injected rat. Scale bar = 50 μm. (B) Schematic diagram of coronal section though rat prefrontal cortex. The portions of area Cg1–3 from which neurons were sampled is shown (shaded areas). Coordinates indicate positions relative to bregma (Paxinos and Watson 1998). (C) Computer-assisted reconstructions of Golgi-stained neurons in layers II–III of mPFC in unstressed (top) and stressed (bottom), uninjected (left), vehicle-injected (middle), and CPP-injected (right) rats. Neurons are representative of apical dendritic lengths near their respective group means. Scale bar = 50 μm.