
Figure 1.
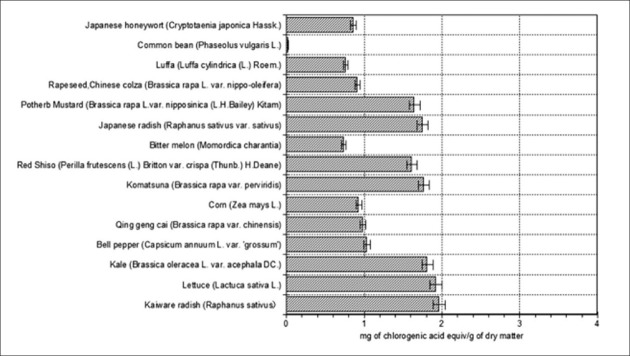
Total phenolic content of aqueous extracts from the seeds of 15 dried plants marketed in Japan. Each end of the vertical bar represents the standard error of multiple (3) samples
Official websites use .gov
A
.gov website belongs to an official
government organization in the United States.
Secure .gov websites use HTTPS
A lock (
) or https:// means you've safely
connected to the .gov website. Share sensitive
information only on official, secure websites.
Total phenolic content of aqueous extracts from the seeds of 15 dried plants marketed in Japan. Each end of the vertical bar represents the standard error of multiple (3) samples