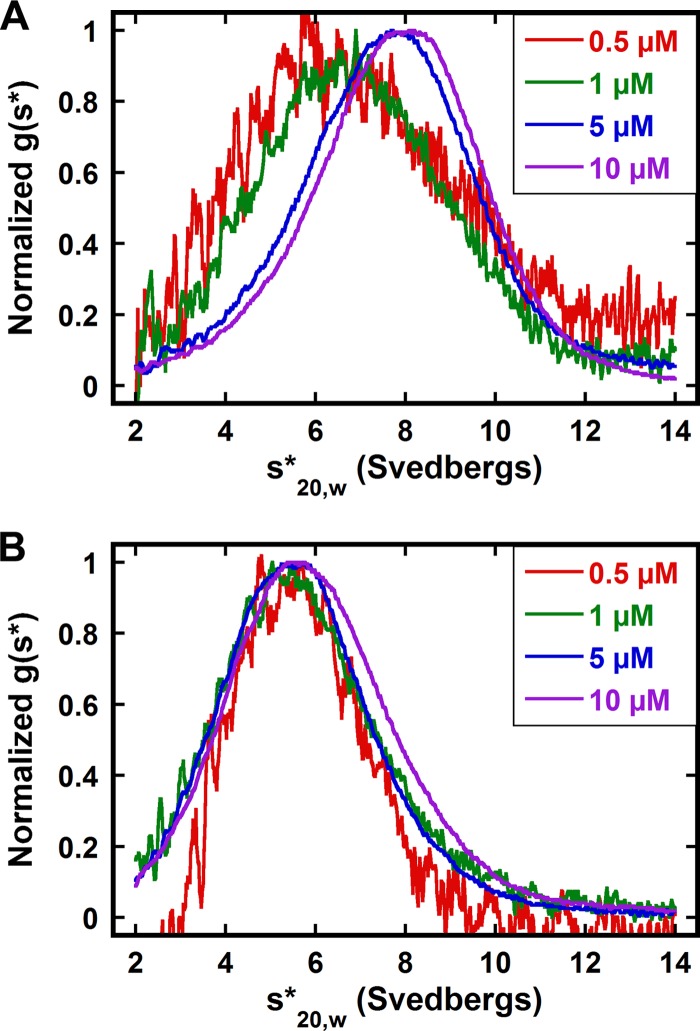
Fig 1.
Sedimentation velocity analysis of SecA (A) and SecA Δ2-11 (B) in 300 mM KCl buffer, shown as normalized g(s*) distributions. Each distribution represents a different protein concentration. The distributions are normalized by amplitude. The sedimentation velocity measurements were performed as described in Materials and Methods.

