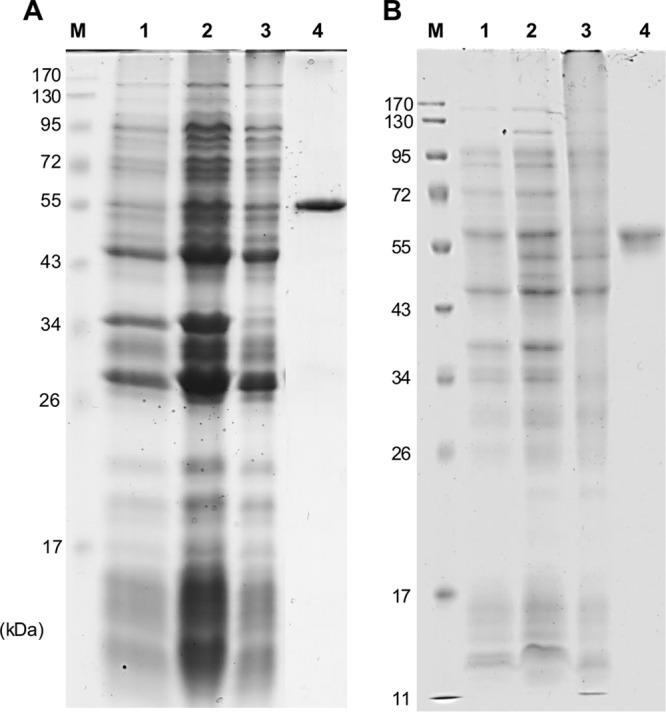
Fig 4.

Analysis by SDS-PAGE of the overexpression of the Hpa (A) and Adh (B) candidate genes in E. coli and of the purification of the His-tagged proteins. Lane M, molecular mass markers; lane 1, whole cells prior to IPTG induction; lane 2, whole cells 5 h after induction; lane 3, soluble protein fraction after ultracentrifugation (100 μg protein); lane 4, protein fraction obtained from affinity chromatography (30 μg protein).
