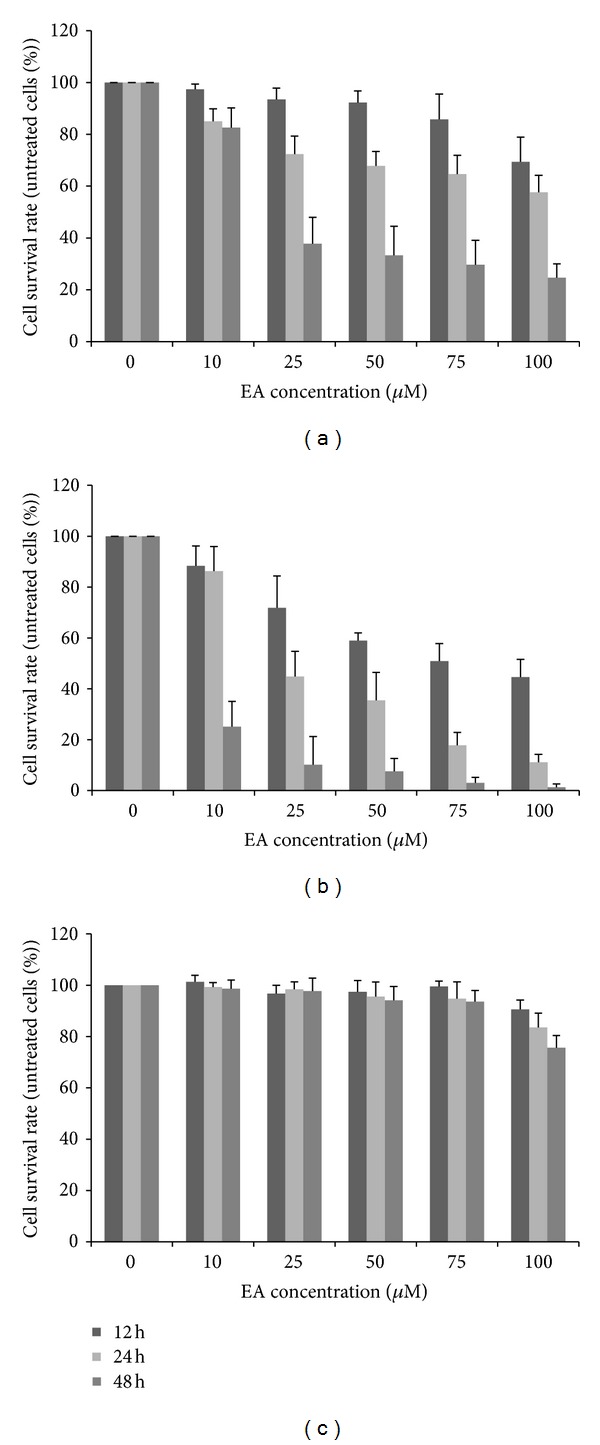
Figure 1.

The dose and time response of ovarian carcinoma cell lines to ellagic acid (EA). A total of 100,000 ES-2 cells (a), PA-1 cells (b), and MRC-5 cells (c) in 6-well plates were treated with increasing concentrations of EA as indicated and then incubated at 37°C for 12, 24, and 48 h. Viable cells were trypsinized, stained with trypan blue, and counted under a microscope. Cell viability was expressed as a percentage of untreated cells. Data are the average of three independent experiments and expressed as means ± SD.
