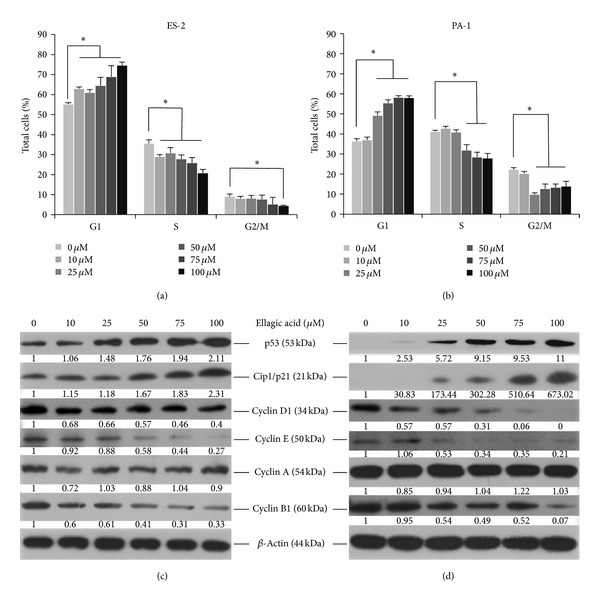
Figure 2.

Cell-cycle arrest in ovarian carcinoma cells by EA. EA-treated cells were incubated at 37°C for 12 h and then fixed in 70% alcohol and stained with propidium iodide then analyzed by flow cytometry, as described in Section 2. The same EA-treated cells were lysed and the cell proteins were separated by SDS-PAGE then immunoblotted to show proteins as indicated with the beta-actin level as the loading control. Protein levels were quantified using Image Lab software (Bio-Rad) according the density of each band on the immunoblotting image, normalized to the reference band (β-actin) and presented as the fold of the untreated control. The cell-cycle distribution and the changes in cell-cycle-associated proteins of EA-treated ES-2 are shown in (a) and (c), respectively, and EA-treated PA-1 are shown in (b) and (d). The data reported are the percentages of total cells from the averages of three independent experiments and are expressed as means ± SD. *P < 0.05.
