Figure 2.

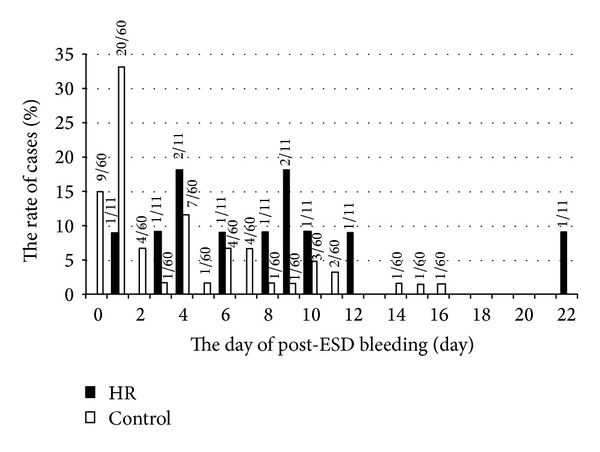
Comparison of the onset of delayed bleeding after ESD between the HR group and the control group. The days of delayed bleeding occurred after ESD in HR group (black bar) and control group (white bar) were shown in the graph.

Comparison of the onset of delayed bleeding after ESD between the HR group and the control group. The days of delayed bleeding occurred after ESD in HR group (black bar) and control group (white bar) were shown in the graph.