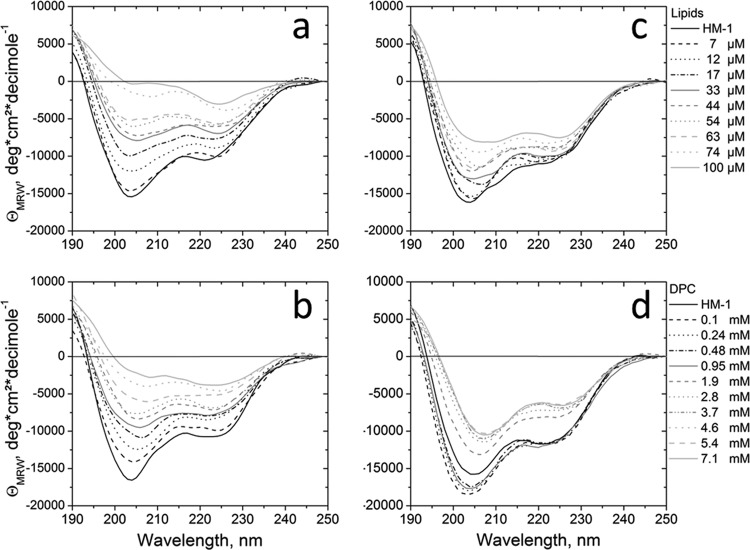
Fig 2.
CD spectra of HM1 with increasing concentrations of mixed SUVs. (a to c) CD spectra were collected for 7 μM HM1 at pH 6.0 at 37°C and lipid SUVs composed of E. coli total lipid extract (a), POPC-POPG (3:1 [mol/mol]) (b), and POPE-POPG (3:1 [mol/mol]) (c) were gradually added. (d) HM1 was associated with DPC micelles at increasing concentrations. The spectra represent the averages of eight measurements. MRW, mean residue weight.

