
Fig 4.
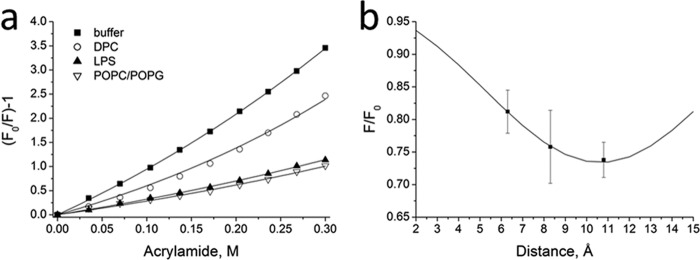
Tryptophan emission fluorescence quenching measurements reveal tryptophan insertion depths of HM1 into lipid bilayers. (a) Stern-Vollmer plot for 3.5 μM HM1 in the absence or in the presence of 7 mM DPC, 56 μM LPS, or 155 μM POPC-POPG (3:1) SUVs at pH 6.0, respectively. Stern-Vollmer quenching constants were calculated according to the fit of the experimental data (see the text for details). (b) Collisional quenching of HM1 tryptophan residues by brominated POPC. Shown is a plot of the fluorescence intensity as a function of quencher distance from the bilayer center. The solid line represents the best fit of the mean of three experiments, with the error bars indicating standard deviations.