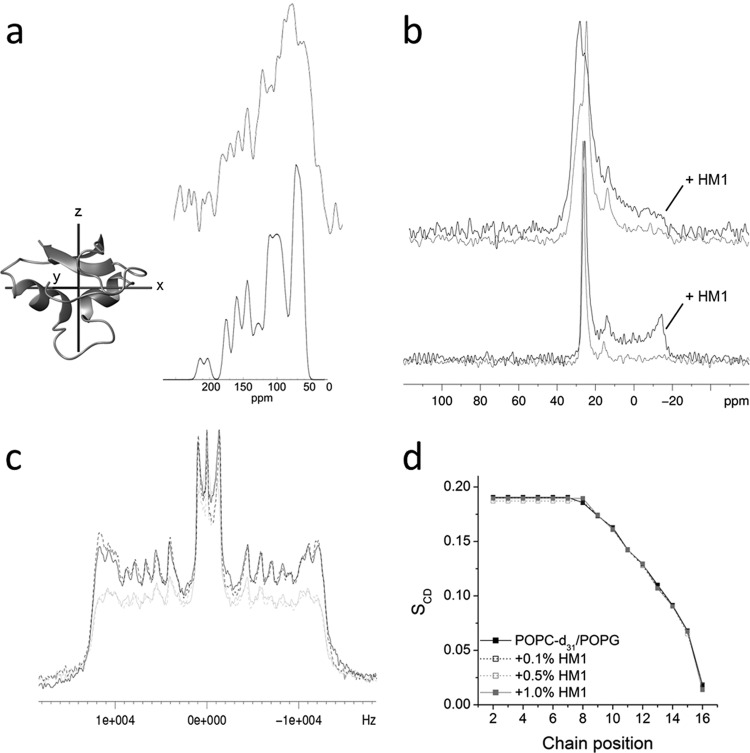
Fig 6.
Topological analysis and lipid interaction measured by solid-state NMR spectroscopy. (a) (Top) Proton-decoupled 1D 15N spectrum of 1.5 mg uniformly 15N-labeled HM1 reconstituted into 60 mg POPC-POPG (3:1 [mol/mol]) oriented bilayers for the membrane normal in parallel orientation to the external magnetic field direction. (Inset) The corresponding simulated 15N spectrum was obtained from the PDB file 2K35 in the manner indicated, with the x axis in plane with the bilayer normal. (b) Proton-decoupled 1D 31P spectra of oriented phospholipid bilayers composed of POPE-POPG (3:1) (top) or POPC-POPG (3:1) (bottom) alone (gray) or in the presence of 0.1 mol% HM1 (black) at 310 K. (c) 1D 2H quadrupolar-splitting spectra of unoriented POPC-d31–POPG (3:1) vesicles were recorded alone (black solid line) or in the presence of 0.1 (black dotted line), 0.5 (gray dotted line), or 1.0 (gray solid line) mol% HM1 at 310 K. (d) Corresponding plot of the order parameter (SCD) for each chain position of the membrane alone or in the presence of increasing HM1 concentrations.

