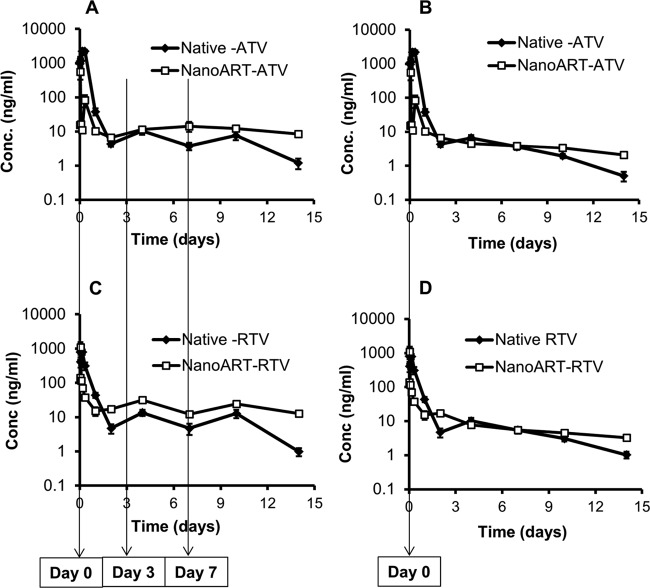
Fig 1.
Serum concentration (Conc.) versus time profiles from the acute-dose studies after three ATV doses at days 0, 3, and 7 (A), a single ATV dose at day 0 (B), three RTV doses at days 0, 3, and 7 (C), or a single RTV dose (D). Data show means ± standard errors of the means (SEM) (n = 5); dose = 10 mg/kg.

