Fig 6.
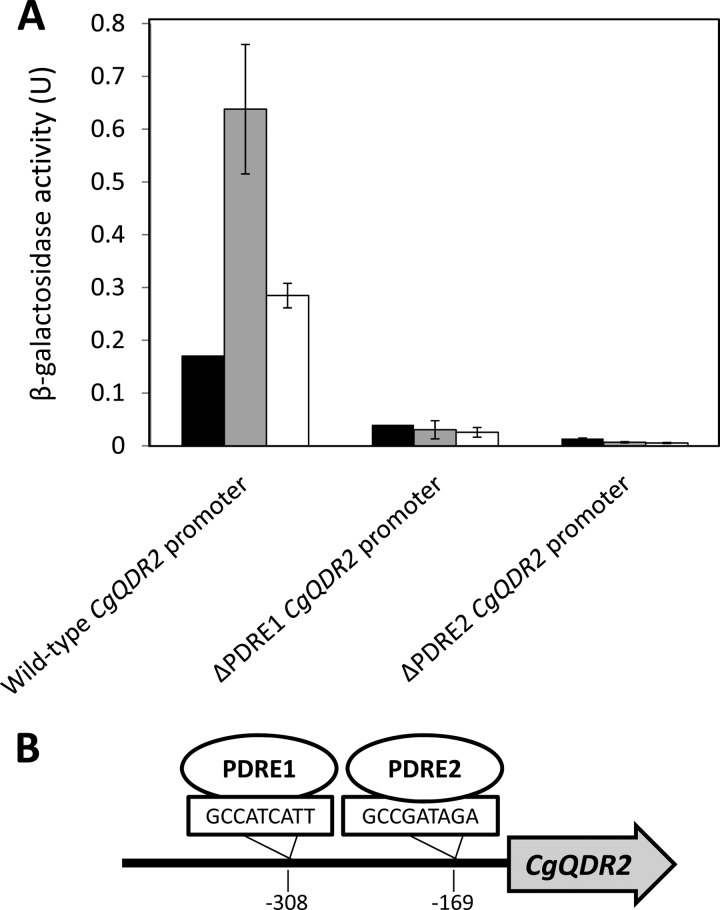
(A) CgQDR2 promoter analysis based on a CgQDR2 promoter-lacZ fusion. The changes in β-galactosidase activity, expressed from wild-type, ΔPDRE1, and ΔPDRE2 CgQDR2 promoter-lacZ fusions, in wild-type L5U1 cells under control conditions (filled bars) or upon exposure for 2 h (shaded bars) or 4 h (open bars) to 30 mg/liter clotrimazole were compared. The values obtained are averages for at least three independent experiments. Error bars represent standard deviations. (B) Schematic representation of the occurrence of predicted CgPdr1 binding sites (GCCATCATT and GCCGATAGA [34]) in the CgQDR2 promoter region, as analyzed with the YEASTRACT database tools (44).

