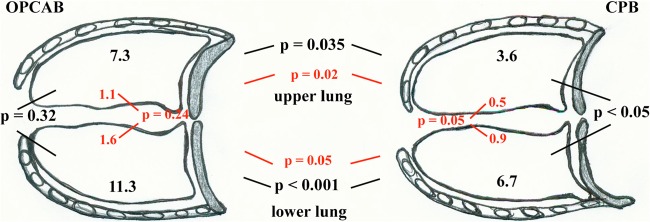
Fig 3.

Regional LVX distribution into lung tissue in the two treatment groups. Values represent median Cmax of LVX concentrations (μg/ml) in the upper lung and the lower lung in both treatment groups (black letters). Values in red represent AUCtissue/AUCplasma ratios in the upper lung and the lower lung in both treatment groups. P values (black or red letters) show the differences between LVX concentrations into the upper and lower lung in each group. P values (black or red letters) additionally show the differences between regional LVX concentrations in lung tissue and AUCtissue/AUCplasma ratios in both treatment groups.
