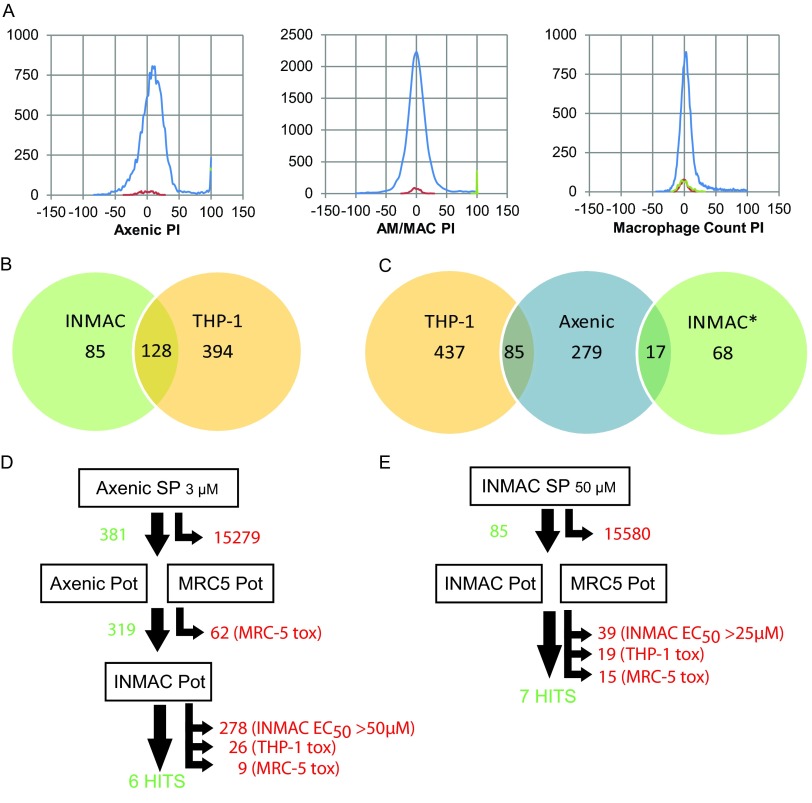
Fig 4.
Screening cascades. (A) Frequency distributions for 15,659 compound diverse library screen against axenic (left panel) and intracellular (center and right panels) Leishmania. The abscissa shows the percent inhibition (PI). Three populations are shown on each frequency diagram: negative controls (red), positive controls (green), and test compounds (blue). Positive controls on the left panel cannot be seen since they are fully covered by the blue line for the test compounds at 100%. (B) Venn diagram for intramacrophage primary screen hits. INMAC, compounds that showed >70% inhibition of intracellular Leishmania; THP-1, compounds that showed >50% inhibition of THP-1 cell count. (C) Comparison of hits from intramacrophage and axenic primary screen. THP-1, compounds that showed >50% inhibition of THP-1 cell count; axenic, compounds that showed >70% inhibition in the axenic primary screen; INMAC*, compounds that showed >70% inhibition of intracellular Leishmania and <50% inhibition of the THP-1 cell count. (D and E) Hit selection in the axenic (D) and intracellular (E) screening cascades. Numbers in green are compounds that progressed to the next step; numbers in red are compounds that were removed from the cascade (no activity, low activity, or toxicity). SP, single point primary screen; Pot, ten-point dose-response curve in duplicate; EC50, concentration at which a 50% effect is seen; tox, <10-fold window between antileishmanial EC50 and THP-1 EC50.

