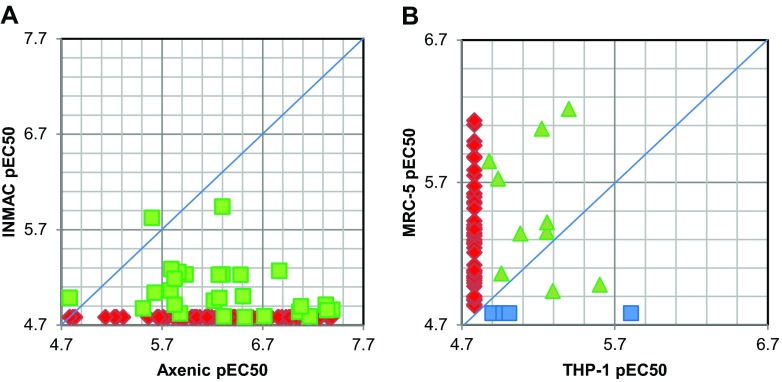
Fig 5.
(A) Comparison of compound potency in axenic and intracellular assays. Compounds on the blue line show equal activity in both assays, and compounds on the right-hand side of the line are more potent in the axenic assay. Red diamonds, no activity in intramacrophage assay (pEC50<4.78, 82 compounds); green squares, activity in both assays (28 compounds). (B) Comparison of compound potency against THP-1 cells and MRC-5 cells. Red diamonds, active against MRC-5 and no activity against THP-1 (pEC50<4.78) (47 compounds); green triangles, activity against both cell lines (10 compounds); blue squares, active against THP-1 and no activity against MRC-5 (pEC50 < 4.78) (4 compounds).

