
Fig 2.
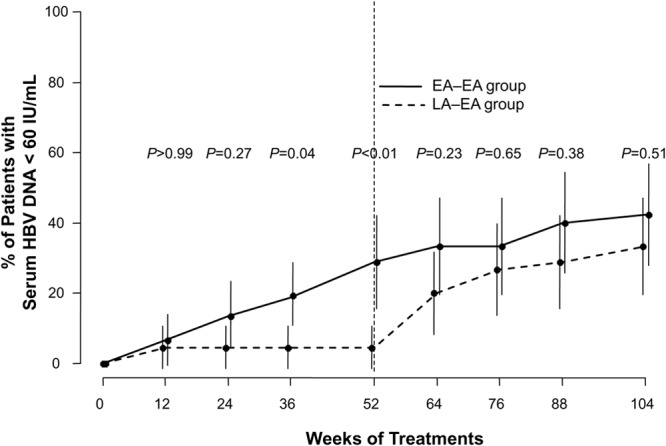
The proportions of patients with virological response (serum HBV DNA < 60 IU/ml) by study visit and treatment group. Baseline is defined as week 0 in the original 52-week study, and the data up to 52 weeks were adapted from the original study (18). The error bars indicate 95% confidence intervals. Fisher's exact test was used for the statistical analysis at each time point.