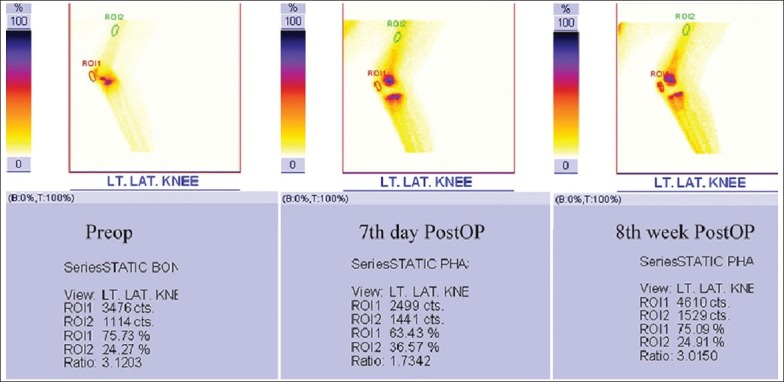
Figure 3.

This is a summed image of the left knee joint in pre-op, 7th day and 8th week post-op showing transient patellar ischemia in the immediate post-op phase which improves at the 8th post-op week. Region Ratio was calculated on the lateral knee image as depicted in this image. The region of interest (ROI) was marked on the patella (‘Target’) and proximal most femoral shaft (‘Non-Target’) that was assumed to be normal. The uptake of MDP in each of these ROI's as marked on the images, was noted as radioactive counts and the ratios of the counts in target ROI's to non-target ROI's (target to non-target ratio-TNT ratio) were calculated separately
