
Figure 8.1.
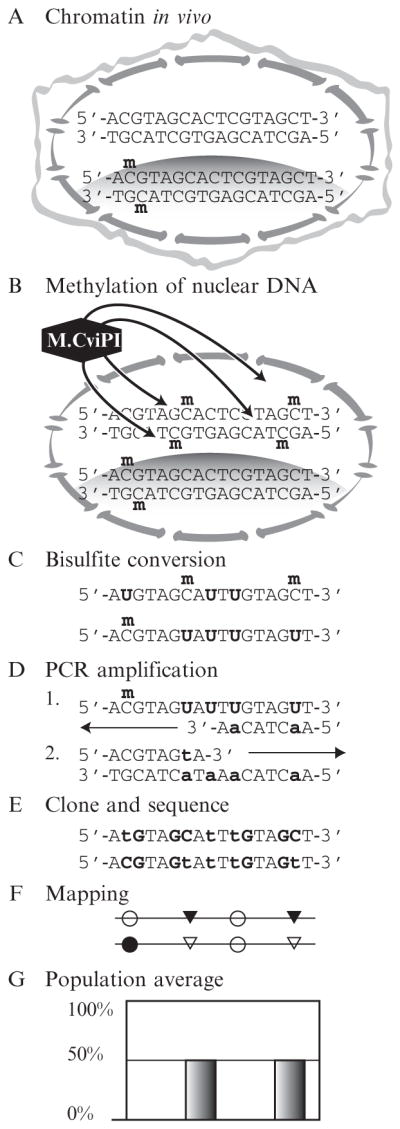
MAPit workflow. (A) In live cells, chromatin structures vary between loci and between copies of the same locus. Here, the upper sequence copy is unmethylated and unbound by protein. The lower has one CG site methylated on both strands and is in a closed chromatin domain, such as a nucleosome, indicated by shading. (B) Cells are lysed while nuclear integrity is preserved. Treatment with recombinant M.CviPI causes methylation of accessible GC sites. (C) Genomic DNA is extracted and treated with bisulfite. Unmethylated cytosine deaminates to sulfonyluracil, becoming uracil upon alkaline desulfonation. Methylated cytosine is unaffected. (D) In two rounds of amplification of the bottom molecule shown in (C), uracil is replaced with thymine, indicated in lower case. (E) Each sequence of an individual DNA molecule records its methylation pattern, that is, chromatin state, specifically, endogenous CG methylation in (A) and accessibility to GC M.CviPI in (B). The DNA sequences shown correspond to the two molecules of (C). (F) After deep sequencing, methylation information is extracted to make structure plots. (G) An assay that measures bulk accessibility at the two GC sites would not report the correlation between them seen when visualizing single molecules from a population as in (F).